1. Aquisition
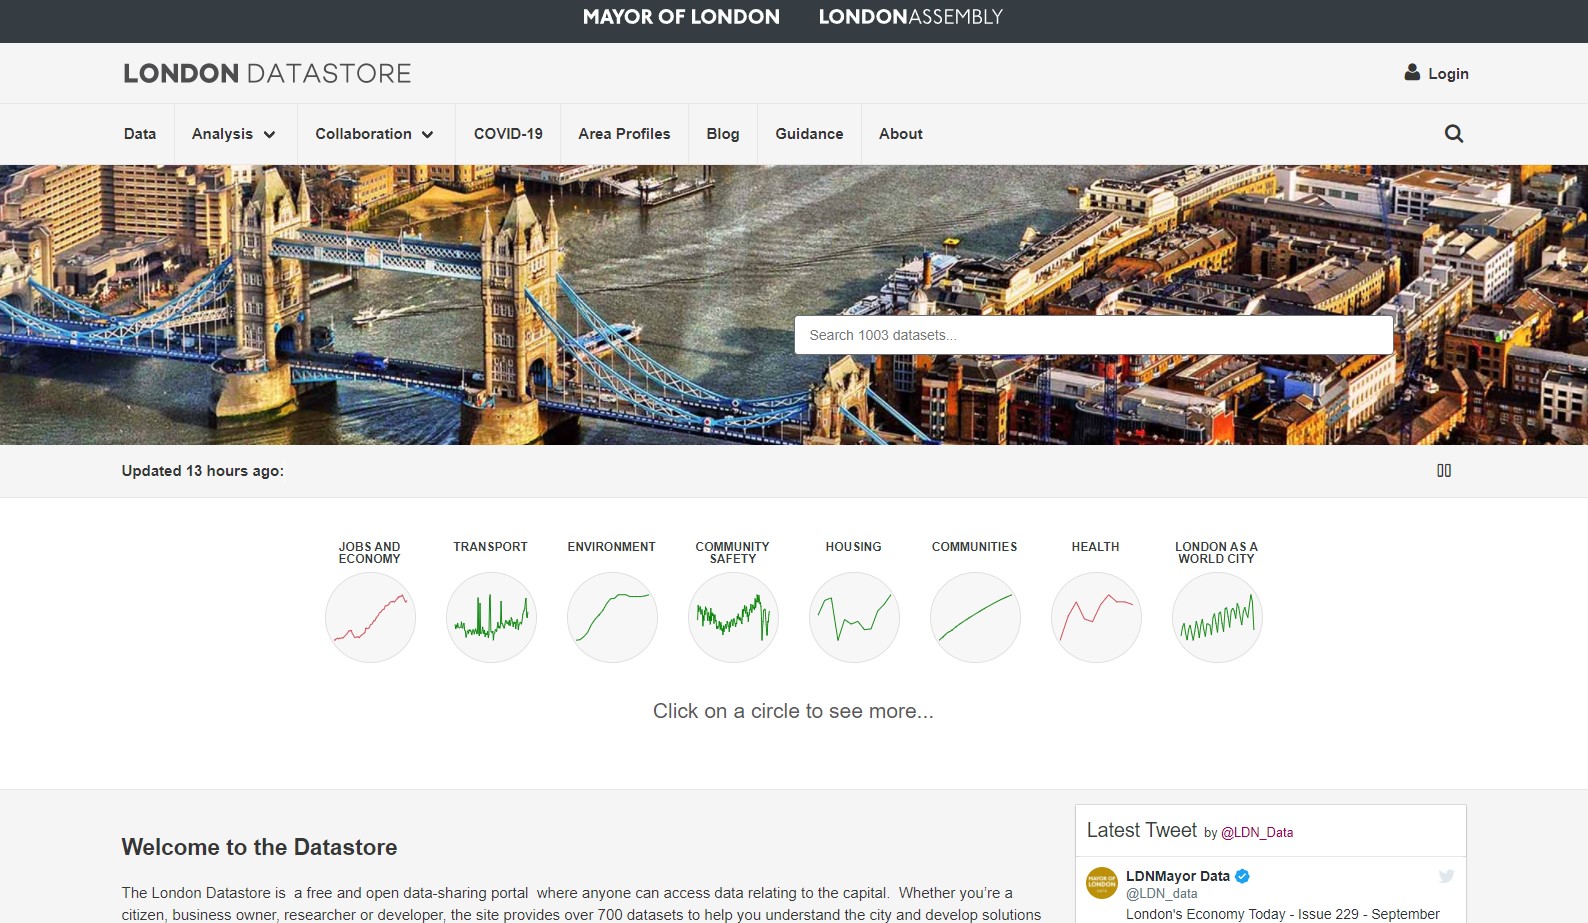
Acquiring our data from the London Data Store.
Clean my dataLONDON ANALYTICS: Machine Learning, SQL, Power Query & Tableau
Data cleaning is an important first step almost every data journey. This is a highly underrated skill! This part of the data lifecycle is often the most time consuming (something also found in my first project).
We have to ensure the data is: reliable; in a readable format for computers; contains no (minimal) missing values. We can use many tools to do this, a few of which, I have demonstrated below.
Each step was completed in order, as laid out below.

Acquiring our data from the London Data Store.
Clean my data
Cleaning data using Excel’s Power Query.
Clean my data
Cleaning in Microsoft SQL Server Management Studio.
Clean my data
Cleaning using Python & Pandas.
Clean my dataOnce the data has been cleaned, we can see what insights we can gain from the power of SQL and simple graphical visualisations using Seaborn. The idea of an EDA is simply to explore, one query may lead to the next, eventually uncovering some interesting insights.

A brief EDA using SQL.
Analysis
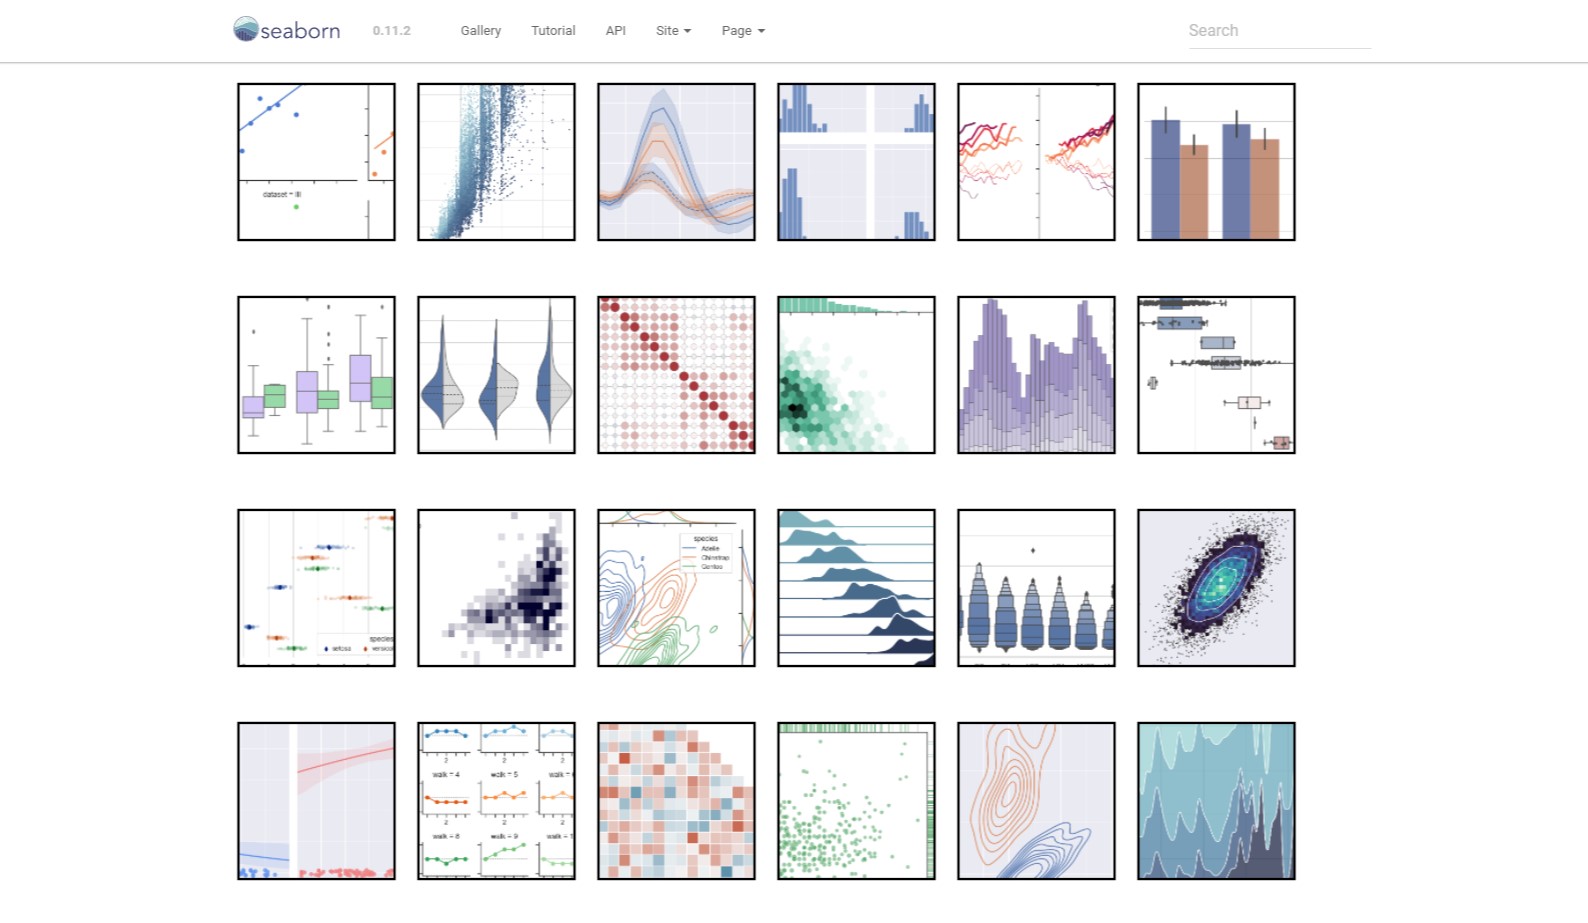
A brief EDA using Seaborn.
AnalysisAfter conducting our EDA we can now move onto the finished products. A dashboard offers the opportunity to present our findings in an interactive way. Machine learning on the other hand lets us use the historic data to predict what will happen in the future!

Tableau Dashboard – London - 2014-2020.
Dashboard
Machine Learning - London Housing - 1995-2021.
Insights